CLARK COUNTY HOUSING
MARKET
MONTHLY REPORT
Even Better News for Buyers
You won’t read this in the paper.
The RMLS stats for October are in. Let’s get started.
Prologue
In my August report I discussed that while we still had a strong seller’s market, indicators were increasingly suggesting a changing market. The number of buyers were on the decline while listings were on the rise. Pending sales were falling despite growing listings. I referenced a piece from the NY Times which noted a national trend for a slowing market. In August it was fairly early, too early to be sure it would continue but it has, in fact, continued to the point that we now have majorly different circumstances for buyers and sellers.
Where we are now
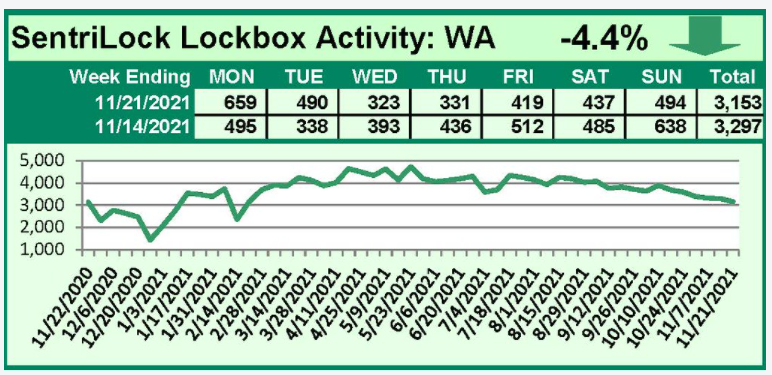
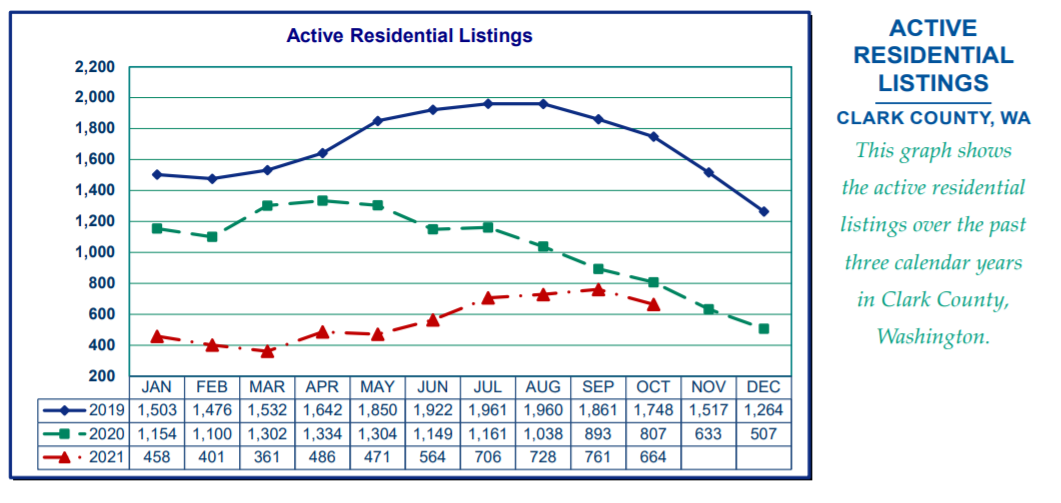
The number of listings has grown steadily in 2021 until October when we experienced the first modest decline. The number of buyers during the same period has been declining steadily since June. Listing declined 14% in October while buyers have declined over 34% since the peak in May.
While this sounds ominous for the sellers market, it actually only shows how strong the sellers market has been this year because I suspect by the end of the year we will likely end up where we were for listings and buyers the same time last year. Which takes us to the question, what should we expect next year.
What Can I Expect Next Year
It is possible and I think likely the market will start the year 2022 in about the same place the market started 2021. From there the market could rev up as strongly as it did in 2021. But as I read the tea leaves I am suspicious that the length of decline in buyer activity (since June) suggests that buyers are tired of the bidding battles and high prices. I expect market conditions will remain a sellers market in 2022 but the buyer hysteria and resulting crazy prices will be gone but for the most popular neighborhoods and homes.
The latest inventory level (the rate of sales expressed as a ratio with listings) is .07 for October. This is exceptionally low even for this market. This number suggests we are still in a market with buyer hysteria. So based on this, my comments above do not sound consistent but let me explain. I believe we are in the early stages of this market change. Keep in mind buyer activity level measurements are accurate within a week. Also, my conclusions are based on my very recent observations as an agent on the ground as well as recent discussions with other agents. But the inventory measure and numbers for listings are based on data about 45 days old. Thus a month ago buyer hysteria was present. Now it is largely gone.
How Does this Changing Market Affect the Price of a Home?
Throughout most of this year, 2121, we saw many homes sell for more that appraisals would support. Many of these sales were either all cash (no appraisal) or with additional cash if the appraisal was low. It was not unusual for the list price to serve as the starting point of offers and for the highest offer to be $5,000 to $25,000 and more above the listing price.
In most cases, this premium above the list price is gone. It is also true that properly pricing a home is more critical than ever. Asking for the sky used to bring showings and offers but not now. A list price just a bit higher than comps suggest will slow down showing activity significantly or stop it altogether.
Is My Home in a Hot Area?
It is critical to know before listing a home if the area is “hot”. Here is what I do. I like to call current listings or pendings nearby and ask the listing agent what they experienced. If they report multiple offers in less than 10 days then you can expect different results than if it took 6 weeks and a price reduction to get an offer. The pricing strategy you use should be adjusted accordingly.