MONTHLY REPORT
You won’t read this in the paper.
Reading the Tea Leaves
WHAT WE CAN EXPECT THROUGH DEC 2020 (and beyond)
Now armed with the latest August Stats we have some answers and predictions.
The die are cast.
Let’s read the tea leaves.
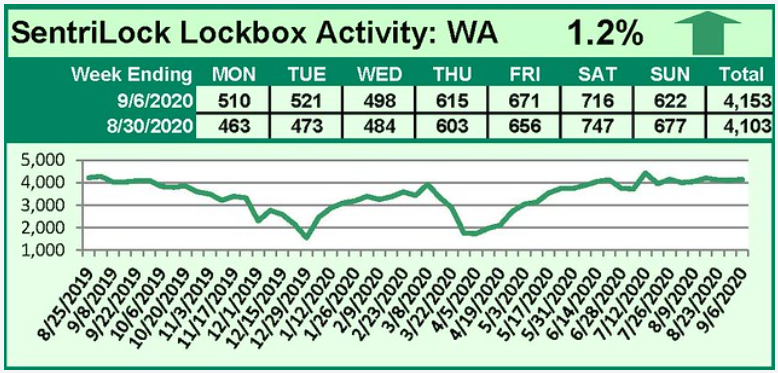
Buyer activity has been steady for several weeks after a steady rise all year. Activity will almost surely gradually begin to fall now that we are well into the seasonal school year slowdown and the holiday season is quickly approaching. (See the graph below.)
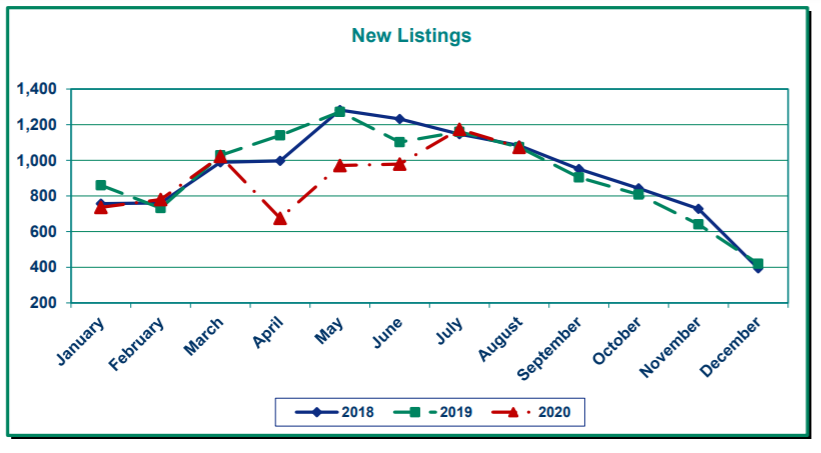
Seller activity has shown recent strong growth in new listings which looked to have the potential to overpower buyer activity and take the market to a neutral position IF new listings continued their growth. This month new listings showed their true colors. The graph below for new listings shows new listings did not surge upward but rather fell off a cliff.
Conclusion:
Buyers continue to show a strong presence while sellers show continued resistance to sell. This market will most likely continue as a seller’s market and home values will rise as they have this past year, at a good strong clip. The rise in home values is discussed in detail below with a red flag waving.
Naturally, there is a dark force in the shadows. (There is always something to worry about, right?) We have millions of potential buyers on unemployment now nationwide and a new surge applying for benefits now. A growing number of major employers, such as airlines, are downsizing now due to the national slowdown. These concerns have not affected the housing market as yet but logic suggests at some point the market will eventually feel it. There will likely be a slowdown but I do not expect a major slowdown before the Covid 19 vaccine comes out and is available the first half of next year. It may take most of 2021, I read, to largely complete the vaccination process so a moderate slowdown will likely occur in 2021. It seems unlikely to be a serious slowdown based on current information.
Look what Home Values have done.
Since January 2020, the average price of a home has gone from $414,000 to $473,000. This is a 21% increase annualized. (14% for the 8 months). This is huge. Historically this is the time to be on the lookout for a major correction. Uncertainty and market corrections are allies. We certainly have uncertainty with Covid 19 and hurricanes and fires and smoke not to mention politics. With this uncertainty is the growing possibility for market correction. We shall keep an eye out in anticipation and early detection.
(Please keep in mind that the best tool we have to monitor home appreciation is average price. This is a clue but not a certain predictor of the value of your home. A formal market analysis or home appraisal is the best way to determine market value for your home.)
Charts and Graphs
Buyer activity/lockbox chart current to about 10 days ago.
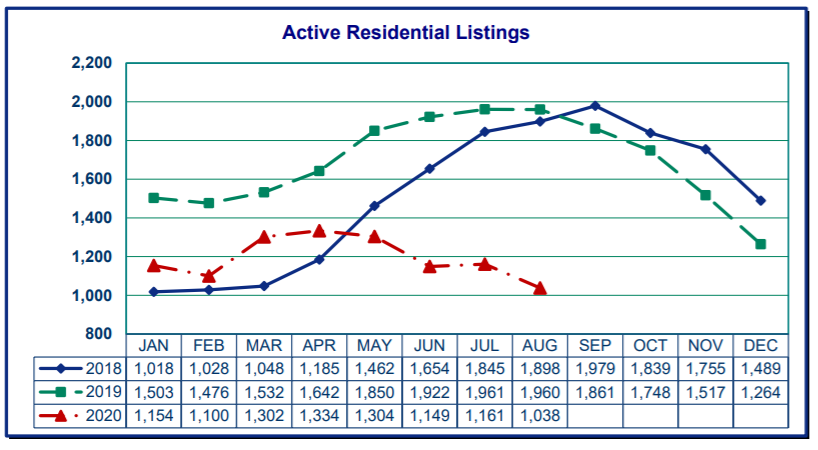
TOTAL listings for August
New listings ended their unseasonable surge upward in August.
Want to sell but are afraid of Covid?
I totally understand your concerns. While there are no 100% perfect ways to eliminate the risk, there are measures one can take to provide substantial protections.
Give me a call and we can talk about these controls.
360-921-2203
test, test comments
Pingback: microgaming casino signup bonus